Battery Compatibility with A Net Zero Grid - Update Nov 2023

Recently, there has been a renewed focus on the zero-carbon credentials of batteries. Coupled with the fact that the batteries themselves do not actually generate any electricity from another form of energy, for example, sunlight or wind, people are asking how we can classify batteries as a zero-carbon or renewable technology.
Foreword
Renewed focus on the true zero-carbon credentials of batteries is not unexpected due to the increased awareness of the public in the embedded carbon which can be described as “the carbon footprint of a building or infrastructure project before it becomes operational”. Coupled with the fact that the batteries themselves do not actual generate any electricity from another form of energy (eg sunlight or wind), people are asking how we can classify batteries as a zero-carbon or renewable technology.
This blog presents an analysis and quantitative outcomes of how a battery scheme can deliver reduced carbon emissions relative to the status quo and are a necessity in the transition to a Net-Zero grid.
Nick Provost, Commercial Manager at Balance Power Projects
How closely are economic and environmental outcomes linked?
To understand the case to assert that a battery can be zero-carbon, an understanding of how a battery will operate and how it derives revenue to provide a feasible, viable and deliverable project is required. The two facets of ensuring viability and minimising the operational carbon footprint of the battery are very closely aligned, it is not an either/or situation and this is explained in more detail below
In lay terms to ensure viability for the battery, the battery will be charged when electricity can be purchased from the grid is at its cheapest and the battery will discharge when the electricity can be sold at the highest price to the grid.
What links the economic and environmental case for batteries are the reasons behind how wholesale electricity prices are driven and feeds price signals which the asset control system will respond to. Prices will be lower when there is an oversupply of generation versus the prevailing power demand and prices will be higher when there is deficit of generation versus the prevailing demand. This is a simple case of supply and demand dynamics.
Traditionally, centralised fossil fuelled power stations could ramp their outputs up and down simply by controlling the flow rate of the fuel into the steam boilers. If prices were too low due to lack of demand, you could choose to ramp down generation and save your fuel for when prices are higher, the opposite is true if prices are too high. What is different about solar PV and wind, the current preferred renewable generation technology in the UK, is that you can’t simply ramp up to meet demand and you can’t save fuel for when prices are higher. The generation happens when it happens as it is an uncontrolled input.
The economics behind supply and demand make sense, but how exactly does this link to environmental benefit?
The key to understanding what the environmental impact will look like for a battery is to look at the carbon intensity of the electricity that would have otherwise been curtailed or would need to be generated if the battery wasn’t present. This may not be the same as the actual real-time carbon intensity of the electricity. This is explained in more detail below.
Charging the battery with zero-carbon electricity
If there is a very windy night, there could be a huge glut in wind power generation, but this will inevitably coincide with the lowest grid demand. This will drive very low wholesale pricing as supply could massively outstrip demand and in extremis the wholesale price will go negative (in effect paying consumers to consume electricity) to help balance the system and keep the grid frequency within acceptable operational tolerances.
If you still can’t find enough additional demand to absorb the glut in power, then the grid will be forced to curtail some generation and will make payments to operators to effectively turn off their assets. These payments cost National Grid ESO around £1,192m in calendar year 2021 and this is forecast to get much higher as more renewable generation technology is installed and commissioned in line with the UK Government’s Energy Security Strategy.
A battery system in this scenario will be able to store some of this excess generation that has come from the over producing windfarm both at a low price but also be zero-carbon. Whilst it would be difficult to categorically prove that all the electricity charging the battery will be zero-carbon, it intuitively makes sense that the battery system will exploit any depression in the wholesale price that will likely be linked to excessive renewable generation.
Discharging the battery by displacing high carbon electricity
At the other end of the spectrum, during periods of high demand it is currently very unlikely that existing renewable generation would be able to deliver all the necessary power to cover this. This will inevitably mean that dispatchable fossil-fuelled power would be required to pick up the slack.
Currently in the UK closed-cycle gas turbines (CCGTs) are the preferred choice to deliver the balance between demand and current zero-carbon generation and it delivers this electricity at a mean of 0.394tCO₂/MWhelec. Whilst this is the preferred choice, this category of generation is finite and if there is low zero-carbon generation or a very high demand then dirtier forms of electricity generation will be called upon, these are predominantly open-cycle gas turbines (OCGTs) and coal which have carbon intensities of 0.651tCO₂/MWhelec² and 0.937tCO₂/MWhelec² respectively.
Intuitively the wholesale electricity price will be at its highest when there is the biggest differential between demand and generation during which points all available types of generation will be operational. Therefore, what a battery can do by exporting power during periods of peak demand when prices are highest is prevent this electricity being produced by high carbon intensity power sources instead. Therefore, a suitably large array of batteries would be able to limit or even eliminate the deployment of coal generation which will be a huge carbon abatement.
Differential in carbon intensity between charging and discharging
Based on the assertions made in the previous two sections, it is always likely that the carbon intensity of the electricity that the battery will displace during the discharging phase will be greater than the carbon intensity of the electricity that the battery will consume during the charging phase. This will still be true when you consider the end-to-end efficiency of the battery system which is in the region of 87-88%.
I see the logic in what you are saying, but what are the numbers?
The exact carbon abatement that a battery system will be able to deliver will always depend on the prevailing conditions that the system operates in, more specifically the types of generation that are operational at any given time.
Note: To prevent confusion between storage capacity and electricity volume which are both measured in megawatt-hour (MWh) or equivalent multiple; this blog will use additional subscripting to provide clarification. MWhcapacity will refer to the installed capacity of a battery system whilst MWhelec will refer to a quantity of electrical energy. Also where possible we reference CO₂e which refers to the equivalent total CO₂ impact of all released greenhouse gases, rather just CO₂ alone.
If we were to take the most extreme example of i) zero-carbon charging, ii) coal generation discharging displacement, iii) a typical battery scheme capacity of 100MWhcapacity and iv) a discharging efficiency of 93.5%; this would give a carbon abatement of 87.6 tonnes for a single complete charging and discharging cycle. This is the equivalent of displacing ≈327,000miles of car usage based on a typical UK car emission of 166.64gCO₂e/km. This should be seen as the upper limit for what a battery can achieve during a single complete cycle.
The most extreme example that has been calculated above however cannot be reasonably extrapolated for every cycle, so we need to determine a more suitable set of assumptions to provide lifetime carbon abatement figures. There is also a locational element to this as well as there are limits to how much power can be transmitted across the grid between assets due to the capacity of the physical infrastructure.
For 2022 the UK carbon intensity for electricity generation is 0.207074tCO₂e/MWhelec as a generic catch-all number3. If we took an assumption that this is representative of the electricity that is charging the battery and we took a conservative case that whilst discharging the battery was only displacing CCGT generated electricity at 0.394tCO₂e/MWhelec then we would get a carbon abatement of 14.72tCO₂e for a 100MWhcapacity system during a single cycle. The calculation steps are below (no intermediate rounding applied):
1. 100MWhcapacity / √87.5% = 106.9MWhelec (106.9MWhelec required to charge the 100MWhcapacity battery)
2. 106.9MWhelec * 0.207074tCO₂e/MWhelec = 22.14tCO₂e released during charging phase
3. 100MWhcapacity * √87.5% = 93.5MWhelec (93.5MWhelec will be discharged from the 100MWhcapacity battery)
4. 93.5MWhelec * 0.394tCO₂e/MWhelec = 36.86tCO₂e abated during discharging phase
5. 36.86tCO₂e – 22.14tCO₂e = 14.72tCO₂e per complete cycle.
If we extrapolate this out over the complete battery operation of up to 20 years then we get an operational carbon abatement of around 126,353tCO₂e. The calculation steps are again below:
1. 14.72tCO₂e/cycle * 1.5 cycles/day * 365 days/year * 98% availability = 7,897tCO₂e/yr
2. 7,897tCO₂e/yr * 20 years * 80% capacity= 126,353tCO₂e
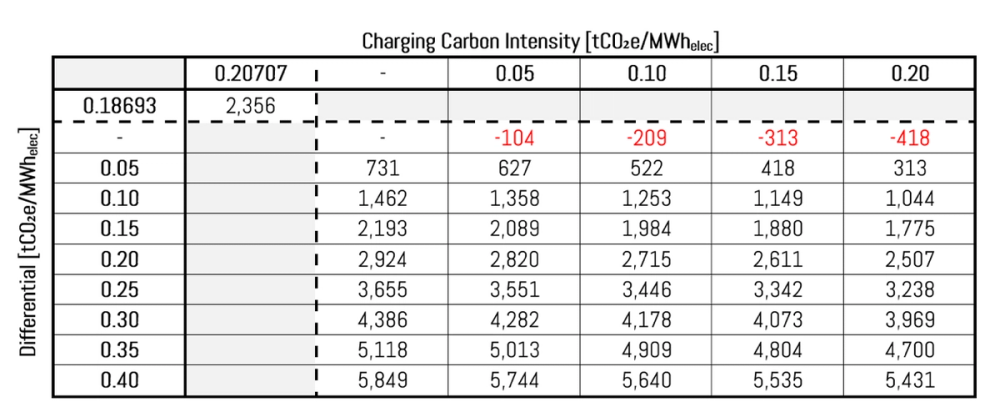
Taking the same car mileage conversion from above, this is the equivalent of ≈471,000,000 miles or removal of ≈2,350 cars off the road for 20 years (based on an annual mileage of 10,000 miles).
1. 126,352,662kgCO₂e / 0.16664kgCO₂e/km / 1.609km/mile= 471,247,538mile
2. 471,247,538mile / 10,000mile/car/yr / 20yr = 2,356 cars
I have a different view; can you provide sensitivities for a comparison?
The differential between the carbon intensity of the electricity consumed to charge the battery and the electricity that the battery is displacing during discharge makes a significant difference to the overall carbon abatement figure. We have pulled together both Exhibit 1 and Exhibit 2 below which shows the carbon abatement values based on various differentials.
Since there is a round trip efficiency that needs to be considered, the absolute values of the charging and discharging carbon intensities do have a minor impact. Therefore, the sensitivity table below is built with two variables. Down the side is the differential between the discharging and charging carbon intensities in relative terms and along the top is the absolute value of the charging carbon intensity. Both sets of values are in tCO₂e/MWhelec.
Exhibit 1: Equipment lifetime carbon abatement (operational phase only)
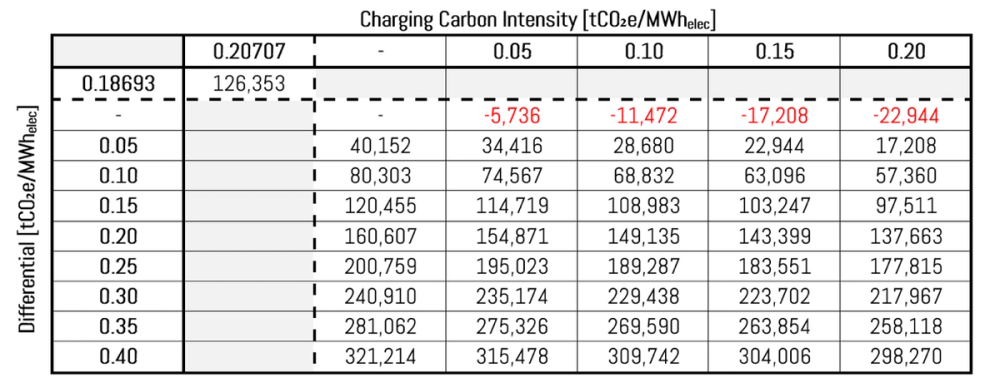
Exhibit 2: Equipment lifetime car removal equivalent (operational phase only)
The only scenarios under which the battery system comes out as a net negative CO2 position will be if the differential between the discharging and the charging carbon intensities is very small (<0.025tCO₂e/MWhelec). Our view is that due to the peaks and troughs of daily demand and the ongoing and increasing volatility of renewable generation, there will often be occasions within each day where there will be a positive differential in favour of the battery.
I can see that the operation provides a positive carbon position, is it bigger than the embedded carbon?
Giving that battery systems are being sold based on their Net-Zero credentials, it is not unreasonable to ask what the carbon impact of the system be outside of the operation of the equipment to consider the overall impact. The theory being that if the embedded carbon released during the construction is greater than the operational carbon saving; from an environmental perspective it would be better to leave the minerals in the ground in the first place.
A study by the IVL Swedish Environmental Research Institute in 2019 indicates that the sum of the material upstream, cell production and pack assembly is in the region of 59 - 119kgCO₂e/kWhcapacity battery capacity. The reason for the wide discrepancy is due to the varying carbon intensity of the electricity used in the cell production which ranged from 0 – 60kgCO₂e/kWhcapacity depending on whether fully renewable sources or dirtier fossil fuels are used.
The summary of the same report indicates that in Europe, the Product Environmental Footprint (PEF) benchmark represents 12% of the total greenhouse gas emissions for batteries in the end-of-life stage. If we took the midpoint of the manufacturing figures in the paragraph above of 89kgCO₂e/kWhcapacity, this would give a figure of ≈100kgCO₂e/kWhcapacity.
Over time we would expect this figure to go down with improvements in battery chemistry, a wider prevalence of renewable electricity within battery manufacturing and improved recycling of key materials. Even today, 3 years after this report was published, the calculated number of 100kgCO₂e/kWhcapacity above may have been improved upon. A 2017 estimate was in the region of 150 - 200kgCO₂e/kWhcapacity reinforces this point.
Further working in the favour of utility scale battery schemes is the economies of scale that could be deployed since this report has calculated the carbon based on EV batteries with a capacity in the order of 10 – 50kWhcapacity, many multiples lower than the utility scale batteries with capacities of ≥50,000kWhcapacity. The theory being that any fixed environmental impact can be spread over a larger capacity that will give a lower unit impact number.
The only carbon that is missing from these calculations is the carbon released during construction of the actual battery scheme itself that would cover items such as the copper extraction, steel manufacture, diesel consumption during transport etc. No reliable estimate has been found that can be used in this blog, therefore this has been omitted rather than providing an estimate with unknown reliability and accuracy.
Going back to the 100MWhcapacity figure that we have used for the operational examples above, this calculates to an embedded carbon figure of 10,000tCO₂e. Taking our default position providing an operational saving of 138,920tCO₂e; this is an equipment lifetime saving of 128,920tCO₂e. This provides an effective carbon ‘return on investment’ of ≈1,300% over a 20-year equipment life.
Exhibit 3 below as an extension of the Exhibit 1 table above to include the manufacturing carbon released.
Exhibit 3: Equipment lifetime carbon abatement (excluding project construction carbon release)
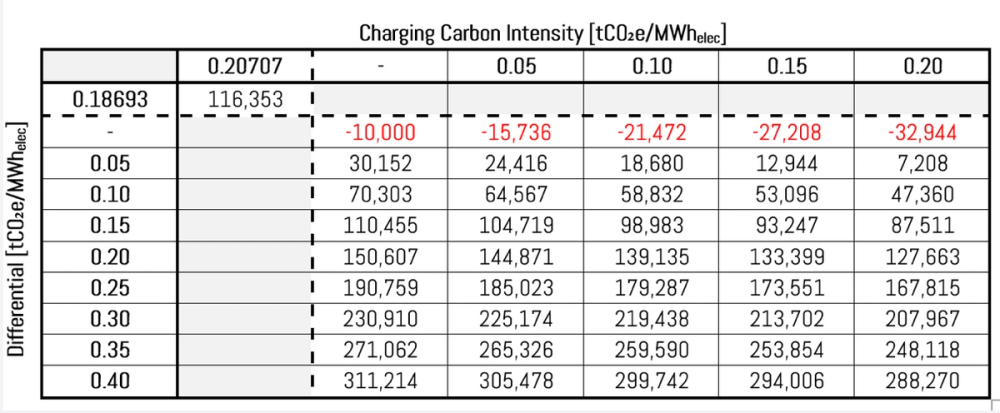
Adding the embedded carbon into the mix, it makes only a small difference to the overall conclusion determined in the previous section. Rather than the smallest required differential being 0.025tCO₂e/MWhelec, this increases to 0.040tCO₂e/MWhelec which based on expected volatility would be easily achievable.
I am not looking at a 100MWhcapacity battery system, can you supply figures on a unit basis?
We have based all the figures in this blog on a 100MWhcapacity utility scale battery system as this is reflective of the typical scale of battery projects being commissioned and energised in the UK in 2023. However, not all projects are uniform and come in different shapes and sizes; for that reason, the metrics that we have calculated for the 100MWhcapacity projects are provided on a MWhcapacity basis.
If you know the capacity of the proposed system you are working with then you can simply multiply that by the final numbers in bold below. The assumptions used are the same as used in the earlier section but are listed here for completeness and ease, if you wish to use alternative figures then you will need to follow the calculation methodologies laid out in the numbered bullets within previous sections.
· Charging electricity carbon intensity = 0.207074tCO₂e/MWhelec
· Discharging electricity carbon intensity = 0.394tCO₂e/MWhelec
· Round trip efficiency = 87.5%
· Operational cycles per day = 1.5
· System availability = 98%
· Equipment lifetime = 20 years
· Mean battery capacity versus installed capacity = 80%
· Car emissions = 166.64gCO₂e/km
· Annual car mileage = 10,000mile
Carbon abatement per complete cycle = 0.1472tCO₂e/MWhcapacity/cycle
Equipment lifetime carbon abatement (operational phase only) = 1,264tCO₂e/MWhcapacity
Equipment lifetime car removal equivalent (operational phase only) = 23.6 cars/MWhcapacity
Embedded carbon (excluding project construction) = 100tCO₂e/MWhcapacity
Equipment lifetime carbon abatement (excluding project construction) = 1,164tCO₂e/MWhcapacity
[1] Figure compiled by Aurora Energy Research from data provided by National Grid ESO covering thermal, voltage and stability constraints
[2] National Grid ESO Carbon Intensity Forecast Methodology – January 2021
[3] UK Government GHG Conversion Factors for Company Reporting Excel file – June 2023
[4] 20 years has been used as that is the useful life of the equipment. A complete project could last up to 40 years, but this would require further procurement
[5] Availability factor to allow for maintenance and other equipment outages
[6] A lithium-ion battery will degrade over the life of the asset to around 60% of its original capacity by year 20 based on a 1.5 cycles per day operational profile. The 80% figure allows for this adjustment